A recent Github issue for OpenAI's Codex on how the harness writes way way too many logs in SQLite started gaining traction the other day, and I wanted to take a shot at figuring out what's going on with it. The issue already outlines most of the problem, but I'm curious what's doing the writes.
There are a lot of tools out there that can help diagnose problems like these by logging or keeping track of queries made to databases like Mysql or Postgres. Postgres has a pg_stat_statements extension you can enable to keep track of what queries are being made, for example. But there's really no equivalent in SQLite. There's no extension for logging queries that I'm aware of, and there's no connection to "proxy" and read incoming queries, all queries are made directly on disk. This problem is already notoriously difficult for many databases, but SQLite is the worst version of it I can think of.
To get around this, I've been working on sqlite-trace, an eBPF program for logging queries made by any unknown binary that links either dynamically or statically against SQLite. Now in this specific case, yes... Codex is open source, and we have a good idea why this logging behavior exists. But there are plenty of closed-source programs that use this database, and sometimes you need runtime instrumentation to get a better idea of what's happening regardless. And currently, that's really difficult to do from the outside.
How do you log SQLite queries?
Let me show how it works first with fossil, a version control system made exclusively for SQLite, and dogfoods the db to store version control data.
xetera@lima-ebpf sudo ./build/sqlite_trace --lib $(which fossil)
...
... I run `fossil new a` in a different folder
... omitted extra queries ...
...
INSERT OR IGNORE INTO user(login, info) VALUES('xetera','')
    fossil pid=56296 db=/Users/xetera/projects/sqlite-trace/a rows=0 rc=101(DONE) t=701.9us
    in: sql=59B bound=0B total=59B (vars=0 scanned=0)
    app: service=fossil exe=/usr/bin/fossil uid=501 gid=1000 ns_pid=56296 cgroup=0x1746 cmd="fossil new a"

UPDATE user SET cap='s', pw='TGHWVvgdDy' WHERE login='xetera'
    fossil pid=56296 db=/Users/xetera/projects/sqlite-trace/a rows=0 rc=101(DONE) t=5.2us
    in: sql=61B bound=0B total=61B (vars=0 scanned=0)
    app: service=fossil exe=/usr/bin/fossil uid=501 gid=1000 ns_pid=56296 cgroup=0x1746 cmd="fossil new a"

INSERT OR IGNORE INTO user(login,pw,cap,info)   VALUES('anonymous',hex(randomblob(8)),'hz','Anon');
    fossil pid=56296 db=/Users/xetera/projects/sqlite-trace/a rows=0 rc=101(DONE) t=4.6us
    in: sql=99B bound=0B total=99B (vars=0 scanned=0)
    app: service=fossil exe=/usr/bin/fossil uid=501 gid=1000 ns_pid=56296 cgroup=0x1746 cmd="fossil new a
It's able to pick up queries the binary makes against the target database, neat.
Normally, this functionality is easily accomplished by attaching uprobes to functions applications call from libraries like libsqlite3. The tricky part is, when installed from apt, fossil doesn't link against it at all.
xetera@lima-ebpf ldd $(which fossil)
        linux-vdso.so.1 (0x0000f0d6c613c000)
        libresolv.so.2 => /lib/aarch64-linux-gnu/libresolv.so.2 (0x0000f0d6c5b50000)
        libssl.so.3 => /lib/aarch64-linux-gnu/libssl.so.3 (0x0000f0d6c5a20000)
        libcrypto.so.3 => /lib/aarch64-linux-gnu/libcrypto.so.3 (0x0000f0d6c5410000)
        libz.so.1 => /lib/aarch64-linux-gnu/libz.so.1 (0x0000f0d6c53d0000)
        libm.so.6 => /lib/aarch64-linux-gnu/libm.so.6 (0x0000f0d6c5300000)
        libc.so.6 => /lib/aarch64-linux-gnu/libc.so.6 (0x0000f0d6c5100000)
        /lib/ld-linux-aarch64.so.1 (0x0000f0d6c6100000)
        libzstd.so.1 => /lib/aarch64-linux-gnu/libzstd.so.1 (0x0000f0d6c5030000)
Which is a huge pain, because it would be so much nicer if we could just hook into a function like sqlite3_step that produces row outputs in the shared library it targets. And this is how some programs work like with the sqlite3 binary itself. Sadly, in just as many other cases, we have to deal with static linking. To make matters worse, fossil and most other production binaries you would be interested in logging strip all their symbols:
xetera@lima-ebpf nm $(which fossil)
nm: /usr/bin/fossil: no symbols
xetera@lima-ebpf nm -D $(which fossil) | grep sqlite
xetera@lima-ebpf
To attempt to solve all this, the program looks for well-known strings that can't be optimized out like cannot commit transaction - SQL statements in progress and abort due to ROLLBACK and follows the chain of calls that reference it down to a plausible looking location.
Also worth keeping in mind that SQLite's public API looks something like this:
typedef struct sqlite3_stmt sqlite3_stmt;

int sqlite3_step(sqlite3_stmt*);
// other public functions...
Where the sqlite3_stmt is an opaque struct. Which means even if you manage to hook the function, you can't actually extract the query from inside the statement, because you don't know what offset that field will be at in that struct. There are other sneaky ways of going about this by hooking sqlite3_prepare functions and extracting the const char* from the parameters there, but then you have to keep track of the pointer that function returns, then aliasing and copying becomes a problem you need to deal with, and it's just a headache in general.
If you really wanted to solve this, you'd need to do something crazy like generate internal type definitions for every published version of SQLite, check which version the target binary is using and use those specific offsets. And that's exactly what the tool does today. Every modern version of sqlite is built from source and turned into a .btf file that includes type definitions for that release.
What codex does
At the time of writing this, the issue doesn't seem to be fixed so I'll go off what I'm seeing on my end by just running the tracer against my version of the binary (0.142.2). Codex seems to perform these two queries within the same transaction as it flushes in-memory logs to its store. Which happens significantly more as it sends requests and streams responses back.
INSERT INTO logs (ts, ts_nanos, level, target, feedback_log_body, thread_id, process_uuid, module_path, file, line, estimated_bytes)
VALUES (?, ?, ?, ?, ?, ?, ?, ?, ?, ?, ?),
       (?, ?, ?, ?, ?, ?, ?, ?, ?, ?, ?),
       (?, ?, ?, ?, ?, ?, ?, ?, ?, ?, ?) -- and so on
DELETE FROM logs
WHERE id IN (
SELECT id
FROM (
SELECT
id,
SUM(estimated_bytes) OVER (
PARTITION BY process_uuid
ORDER BY ts DESC, ts_nanos DESC, id DESC
) AS cumulative_bytes,
ROW_NUMBER() OVER (
PARTITION BY process_uuid
ORDER BY ts DESC, ts_nanos DESC, id DESC
) AS row_number
FROM logs
WHERE thread_id IS NULL
AND process_uuid IN (?)
)
WHERE cumulative_bytes > ? OR row_number > ?
);Along with this third one, they make up the overwhelming majority of the queries being run within a 5 minute light coding test session.
SELECT process_uuid FROM logs
WHERE thread_id IS NULL AND process_uuid IN (?)
GROUP BY process_uuid
HAVING SUM(estimated_bytes) > ? OR COUNT(*) > ?;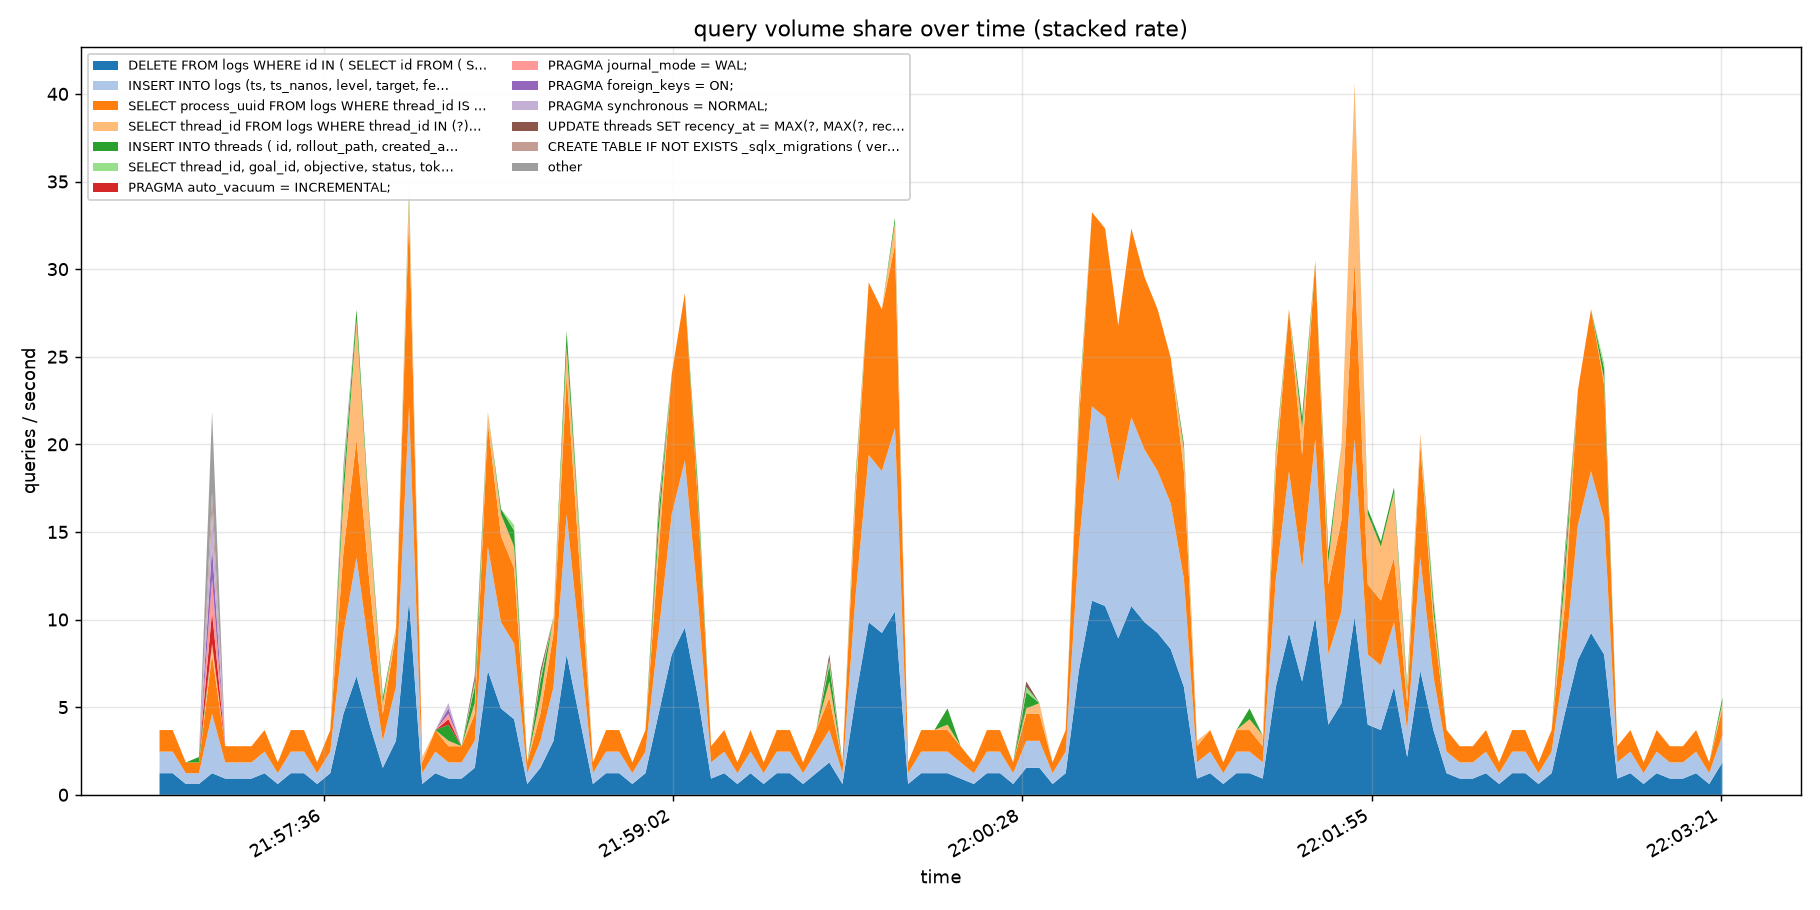
Many of the inserts are batched with 700+ entries at a time, most of which are TRACE logs that definitely should not have been enabled by default in production.
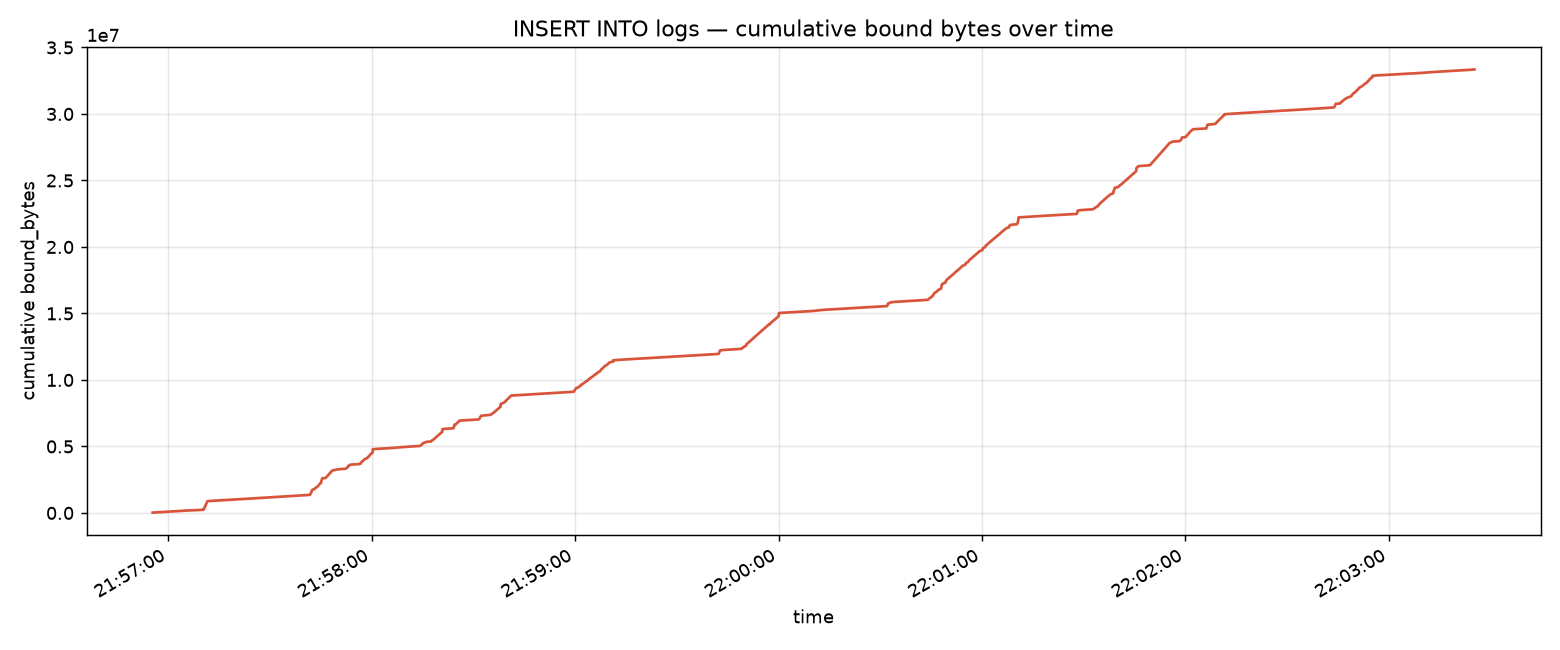
The total amount of data sent through INSERT statements as parameters in function calls grows fast over the course of 5 minutes too. Up to almost 35MB in total. In reality this value is a lot higher than that figure, as mutliple indexes have to be updated and shuffled around for each insert.
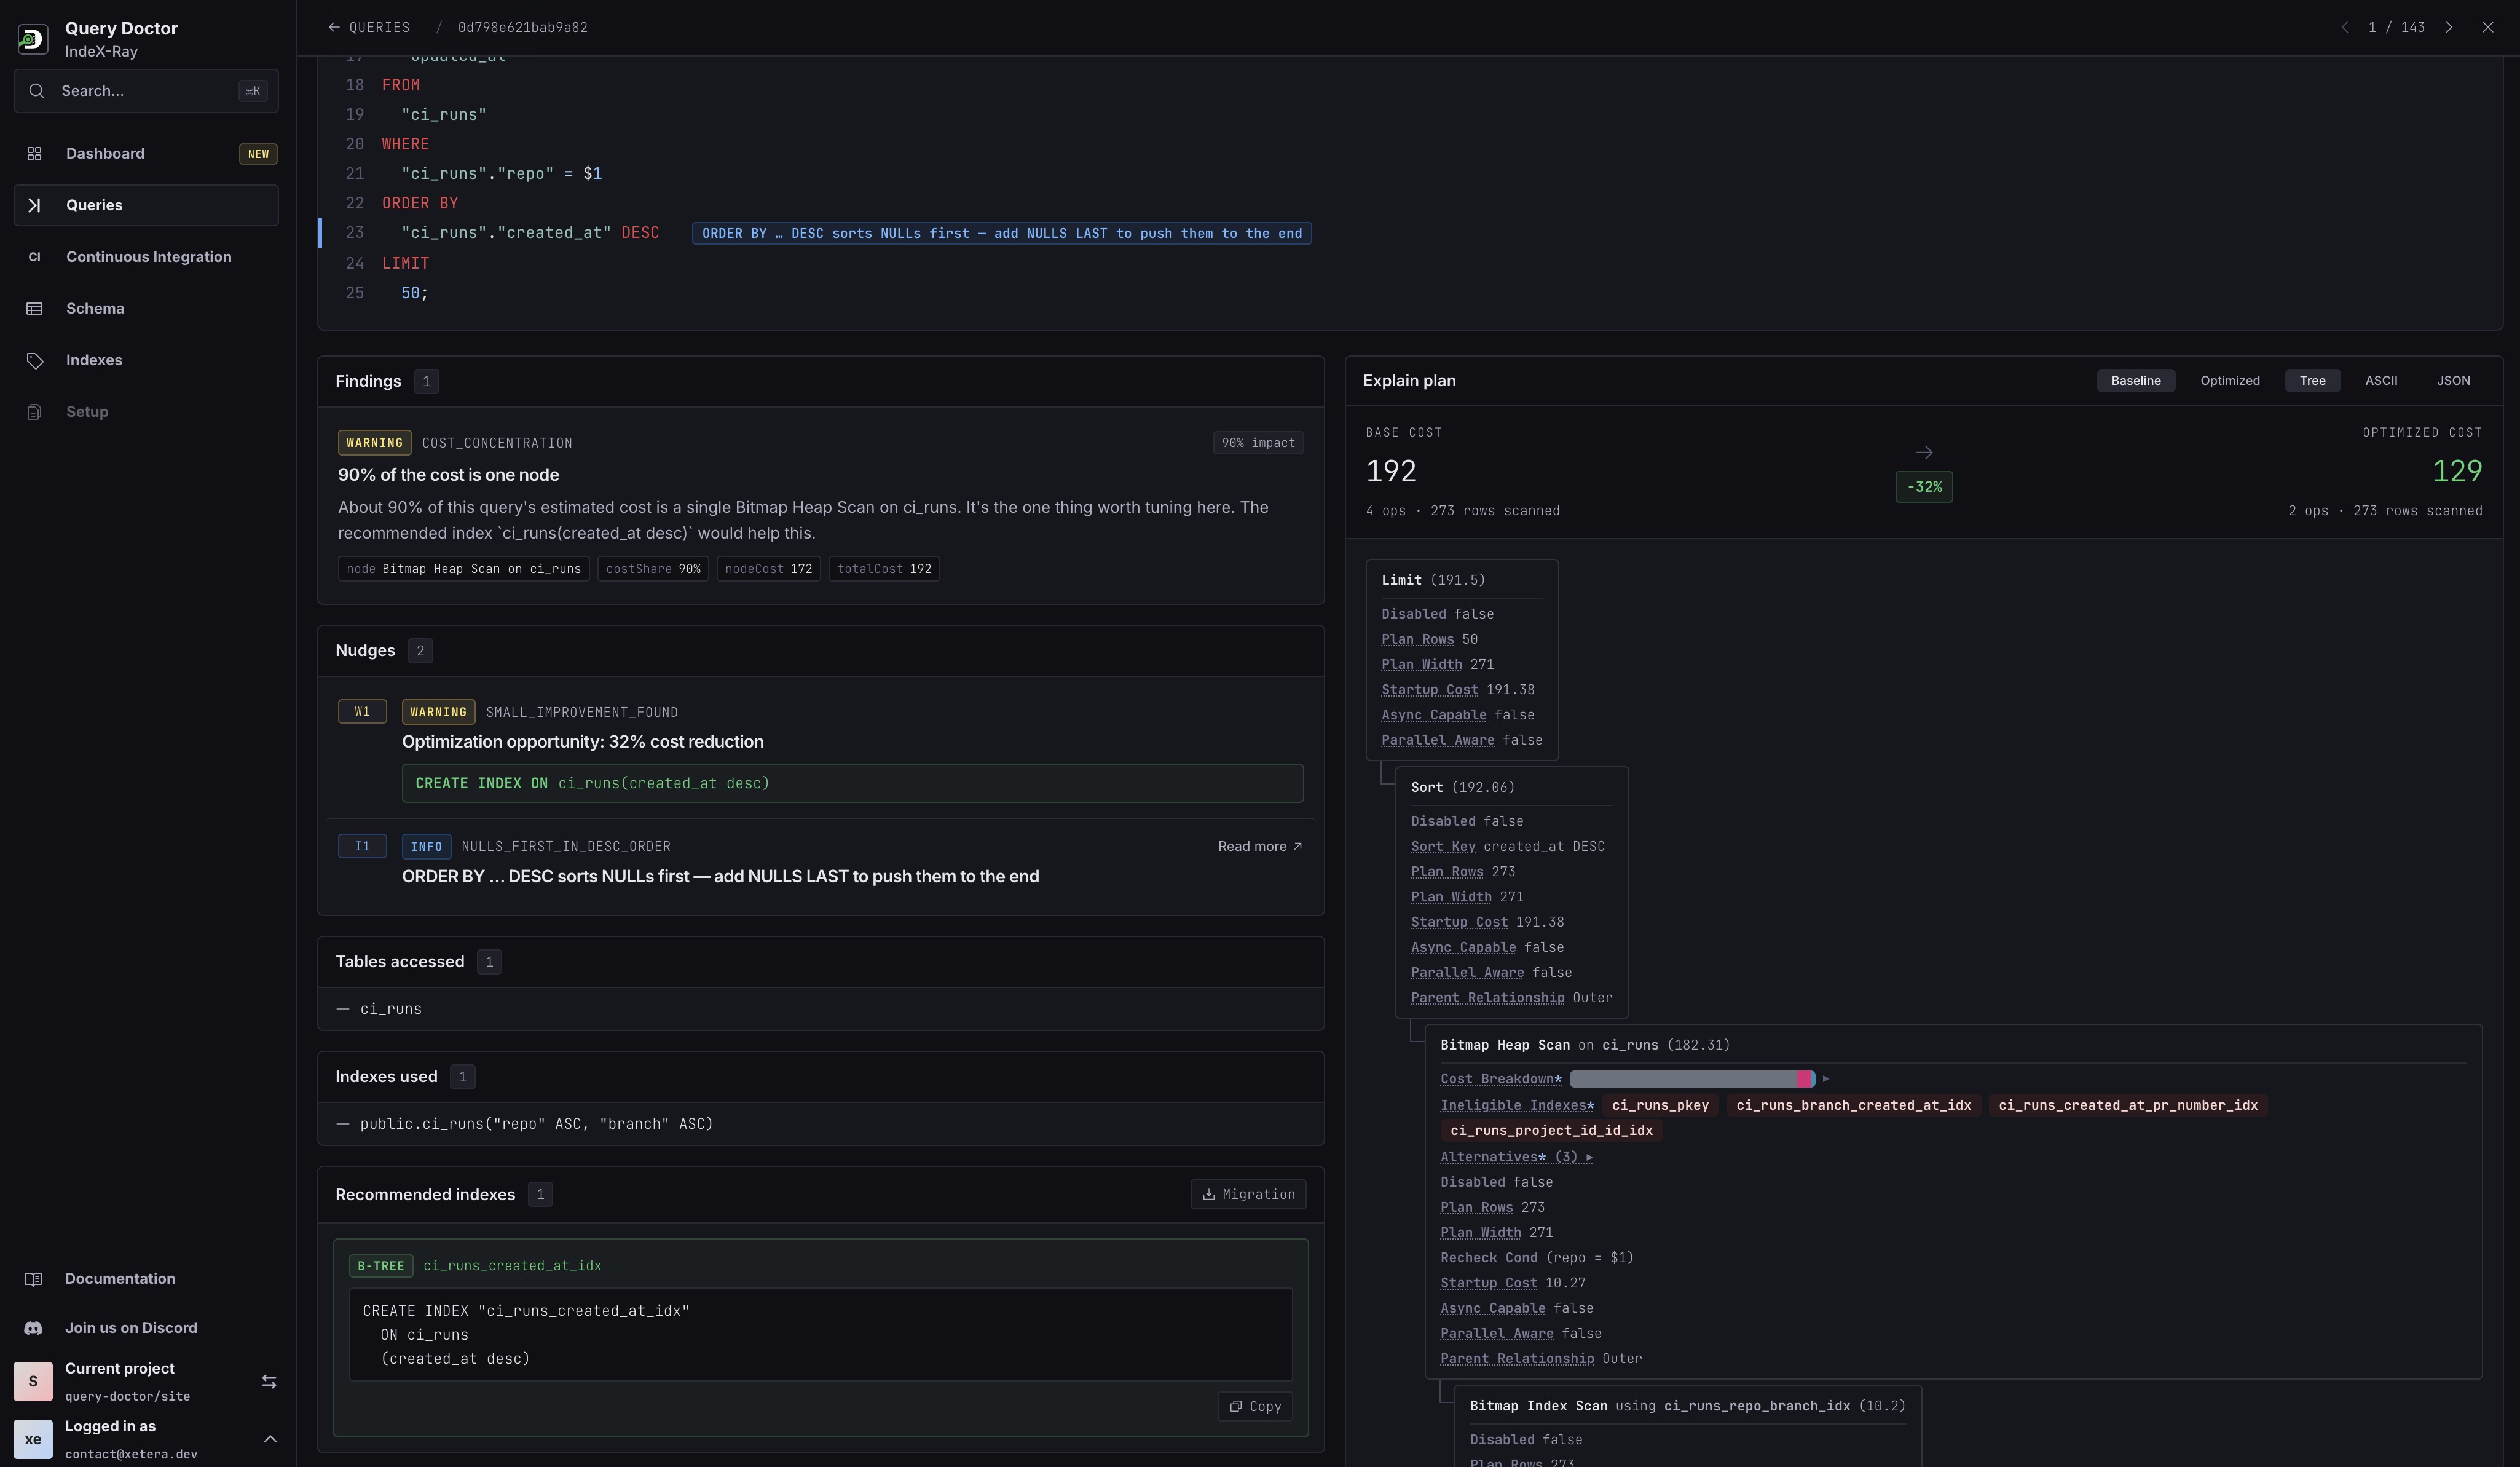
There's another interesting finding here when we introspect the logs db with .schema logs
CREATE TABLE logs (
    id INTEGER PRIMARY KEY AUTOINCREMENT,
    ts INTEGER NOT NULL,
    ts_nanos INTEGER NOT NULL,
    level TEXT NOT NULL,
    target TEXT NOT NULL,
    feedback_log_body TEXT,
    module_path TEXT,
    file TEXT,
    line INTEGER,
    thread_id TEXT,
    process_uuid TEXT,
    estimated_bytes INTEGER NOT NULL DEFAULT 0
);
CREATE INDEX idx_logs_ts ON logs(ts DESC, ts_nanos DESC, id DESC);
CREATE INDEX idx_logs_thread_id ON logs(thread_id);
CREATE INDEX idx_logs_thread_id_ts ON logs(thread_id, ts DESC, ts_nanos DESC, id DESC);
CREATE INDEX idx_logs_process_uuid_threadless_ts ON logs(process_uuid, ts DESC, ts_nanos DESC, id DESC)
  WHERE thread_id IS NULL;
The index idx_logs_thread_id is unnecessary here because it shares the same prefix with idx_logs_thread_id_ts, and causes slightly more churn than necessary since the db has to do extra work to maintain an index when it could be useing the other one instead.
There are some instances where an index with fewer columns could speed up the most critical queries, since fewer pages are being fetched from disk, but that's not relevant in this case. Getting rid of that index entirely would reduce writes.
In my opinion, not only should the TRACE level not be enabled by default in production, but no logs should be getting persisted unless the user turns it on for debugging. The entire point of the logs table is for a single submit feedback feature. But somehow, it's being updated, deleted, and queried (huh?) multiple times a second without even submitting feedback. There are big indexes being maintained exclusively to speed up the deletion. This is no way to treat a database.
If you enjoy database observability, we're building a more advanced version of the tool here for your production apps that use Postgres. Showing you the best index for each query, along with query rewrite opportunities and much more. Check it out here